
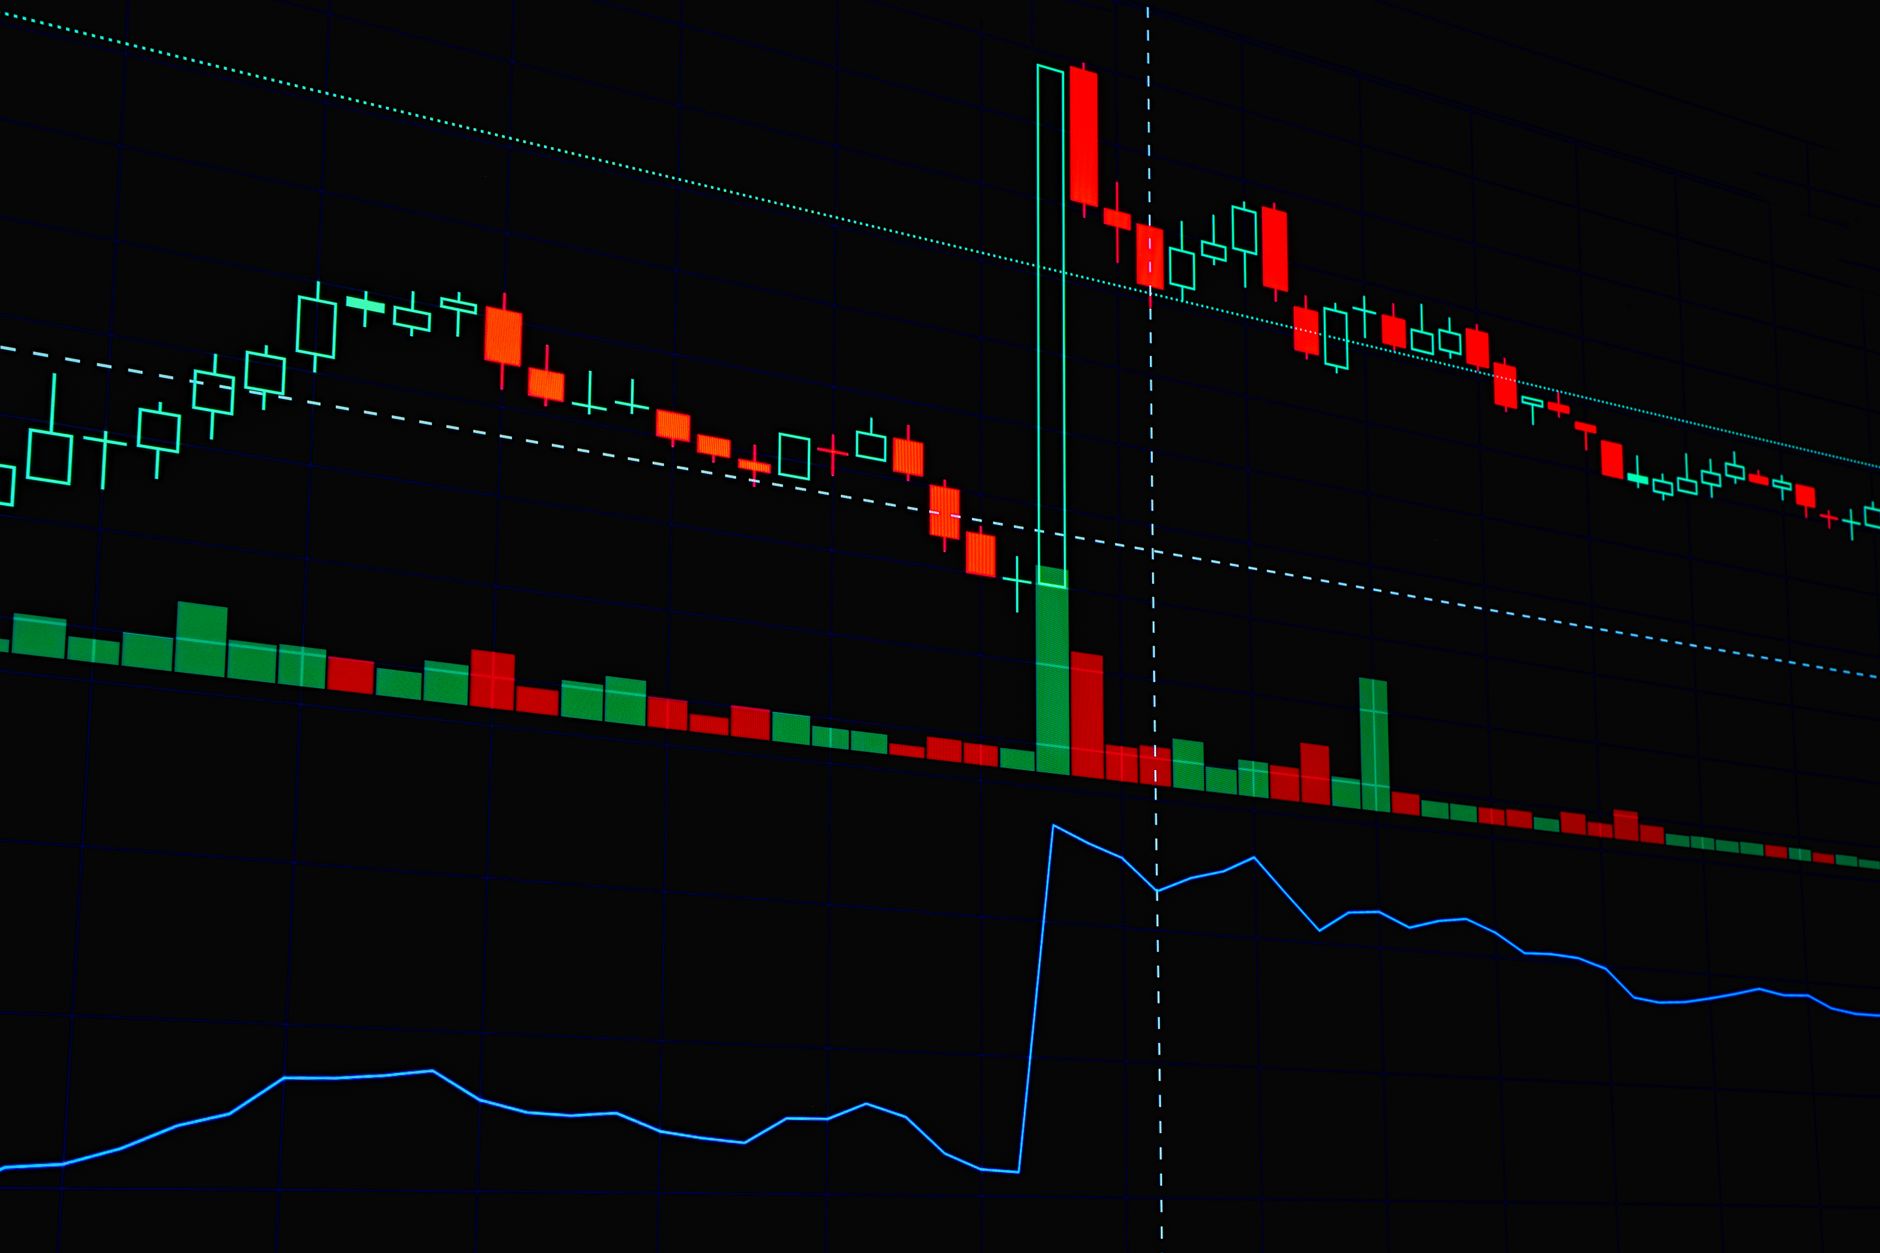
Bullish Divergence: Proven Insights for Market Investors
bullish divergence indicates a potential market shift, and understanding this concept can significantly impact your trading decisions. The recent analysis by Anand Rathi highlights its importance in current market trends.
Understanding Bullish Divergence
Bullish divergence is a technical analysis concept that arises when the price of an asset makes a new low while an indicator, such as the Relative Strength Index (RSI), forms a higher low. This situation often signals a potential reversal in the market trend, suggesting that buying pressure may be increasing despite the falling prices.
Market analysts, including experts from Anand Rathi, emphasize the importance of recognizing bullish divergence as it can provide valuable insights for investors. Understanding this indicator can help traders identify potential entry points in a recovering market. When the Nifty price shows signs of a bullish divergence, it reflects a divergence between price action and momentum, which could indicate a shift in investor sentiment.
Investors should pay close attention to these signals, as they can represent opportunities for profit. Properly interpreting bullish divergence can enhance investment strategies and lead to more informed decision-making.
How to Identify Bullish Divergence
Identifying bullish divergence can be a crucial skill for market investors looking to capitalize on potential upward price movements. To spot this pattern, follow these steps:
- Monitor the Price Action: Begin by observing the price trends of the asset. Look for a series of lower lows in the price chart.
- Check the RSI: Next, analyze the Relative Strength Index (RSI). A bullish divergence occurs when the RSI shows higher lows, contrasting with the lower lows in the price.
- Confirm the Divergence: Once the divergence is noted, confirm the signal by waiting for the price to break above recent resistance levels, thereby validating the bullish trend.
- Use Additional Indicators: Consider using other technical indicators, such as moving averages, to further support the bullish divergence signal.
By carefully analyzing these elements, investors can effectively identify bullish divergence and make informed trading decisions.
Market Implications of Bullish Divergence
The market implications of bullish divergence are significant for investors seeking to capitalize on potential price reversals. When a bullish divergence is identified, it typically suggests that a security may be poised for an upward movement despite recent declines in price. This phenomenon often occurs when the price of an asset makes lower lows while the Relative Strength Index (RSI) records higher lows, indicating a weakening selling pressure.
Investors should pay close attention to such signals, as they can provide valuable insights into market sentiment and potential buying opportunities. It’s crucial to combine these technical signals with other fundamental analyses to enhance decision-making. Key implications include:
- Increased buying interest as market participants look to enter positions.
- Potential for price stabilization and a subsequent rally in the asset’s value.
- A shift in sentiment from bearish to bullish, attracting further investment.
Overall, understanding these implications can empower investors to make informed choices in volatile market conditions.
Expert Insights from Anand Rathi
In a recent analysis, Anand Rathi’s expert highlighted the significance of the price-RSI combination in identifying potential bullish divergence in the Nifty index. This divergence often signals a shift in market sentiment, prompting investors to reassess their strategies.
According to the expert, the current market conditions exhibit promising signs.
- Technical Indicators: The RSI has shown lower lows, while the price action reflects higher lows, creating a classic bullish divergence scenario.
- Market Sentiment: Increasing investor confidence could lead to a rally, especially if volume supports these movements.
- Investment Strategies: Investors should consider this divergence as a potential buying opportunity, aligning with broader market trends.
As Rathi emphasizes, recognizing such patterns can be crucial for making informed investment decisions and capitalizing on upcoming market movements.
Key Indicators for Investors
Investors looking to capitalize on market trends should pay close attention to key indicators that signal potential bullish divergence. These indicators can provide critical insights into market movements and help investors make informed decisions.
- Relative Strength Index (RSI): A crucial tool, the RSI can indicate whether an asset is overbought or oversold, highlighting potential reversal points.
- Price Action: Monitoring price patterns alongside RSI readings can reveal discrepancies that suggest bullish divergence, where prices create lower lows while the RSI forms higher lows.
- Volume Trends: An increase in trading volume accompanying bullish divergence can confirm the strength of the potential reversal, indicating robust investor interest.
- Market Sentiment: Understanding the overall market sentiment can provide context to these indicators, helping investors gauge whether to enter or exit positions.
Incorporating these key indicators into investment strategies can greatly enhance decision-making, particularly when considering patterns of bullish divergence.
Photo by Rafael Minguet Delgado on Pexels
Sources
Related reading